Venture capital returns are the gains limited partners realize from venture fund investments, made up of distributions received plus the residual value of holdings still in the portfolio. A power law shapes those returns, where a small number of winners produce most of a fund’s value while many investments return little or nothing.
A venture fund turns called capital into distributions across a ten-year life, drawing money from limited partners as deals arise, investing in startups, and returning proceeds through IPOs or acquisitions. Gross returns erode to net under the standard 2-and-20 load, a 2% annual management fee plus 20% carried interest on profits.
Venture capital returns are measured through IRR, MOIC, DPI, and TVPI. IRR captures annualized performance but distorts under early valuations, MOIC shows the cash multiple without timing, DPI counts realized cash, and TVPI combines realized and unrealized value. Top-quartile funds clear net IRRs above 20% and TVPIs above 3.0x while median funds land well below, and whether venture capital beats the S&P 500 depends entirely on the horizon measured.
What Are Venture Capital Returns?
Venture capital returns are the financial gains that limited partners (LPs) receive from investments in venture funds. Two components make up the total: distributions, the cash returned from successful exits, and the residual value of the remaining portfolio.
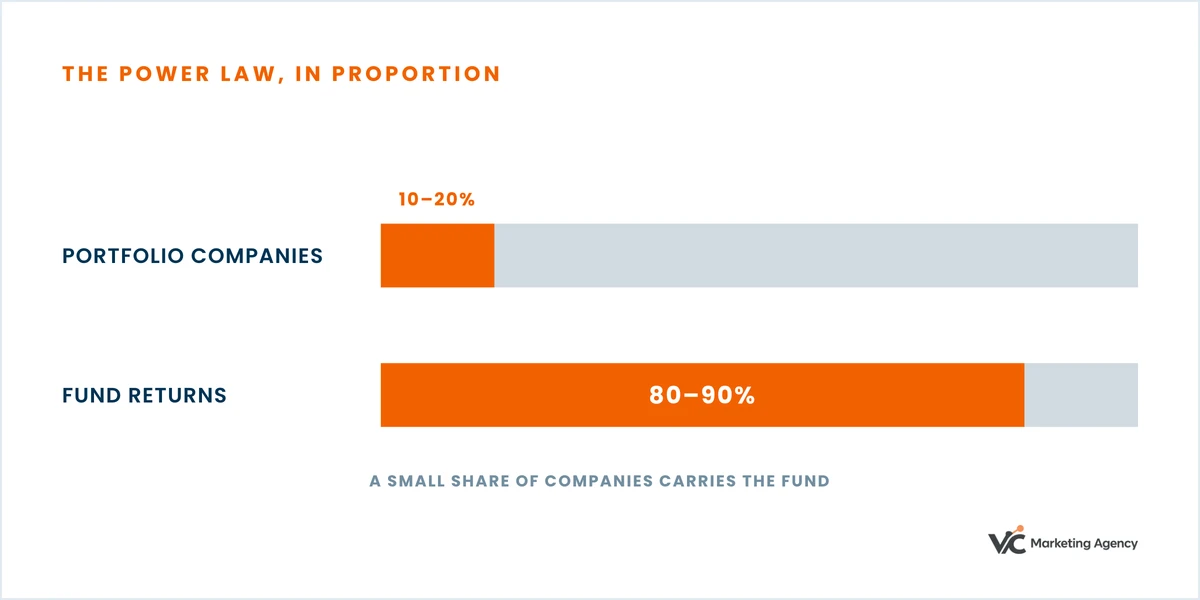
A power-law distribution defines the shape of venture capital returns, where a small number of investments generate the majority of a fund’s total gains. Most holdings contribute little, and a handful carry the fund.
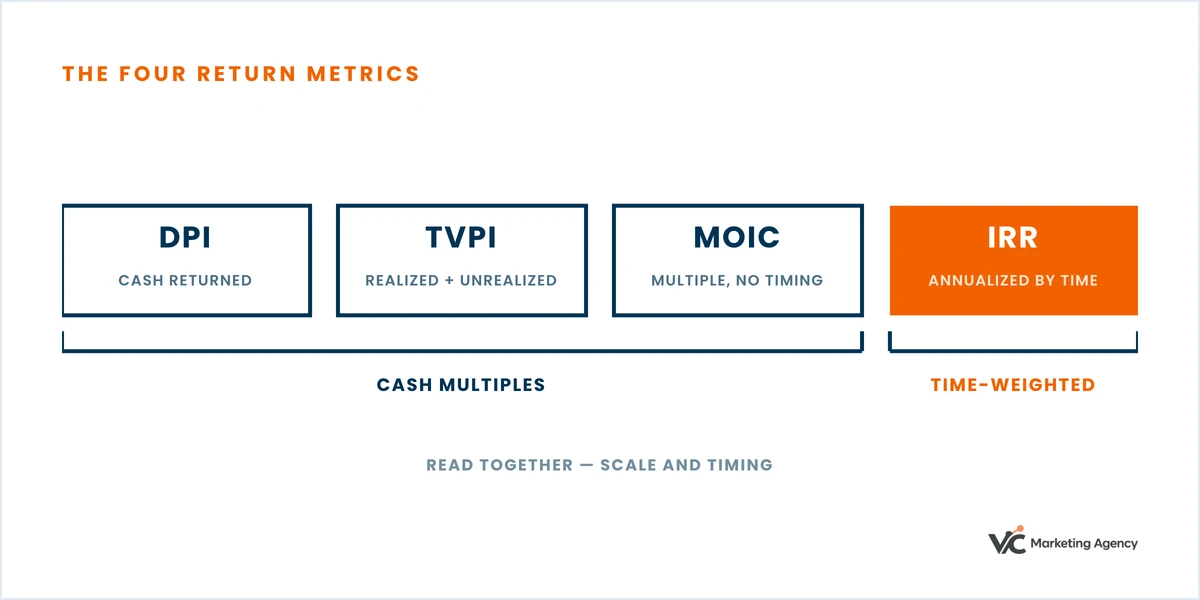
Measurement runs on DPI (Distributed to Paid-In Capital), TVPI (Total Value to Paid-In Capital), MOIC (Multiple on Invested Capital), and IRR (Internal Rate of Return). DPI reflects cash distributed to investors, TVPI and MOIC account for realized and unrealized value together, and IRR adjusts performance for time.
How Do Venture Capital Returns Work?
Venture capital returns work through power-law dynamics running across the capital-call-to-distribution cycle. Limited partners commit capital that the fund draws down gradually as investment opportunities arise, and roughly 10% to 20% of portfolio companies drive 80% to 90% of total fund returns.
Returns follow a J-curve. Fund performance reads negative in the early years under management fees and early-stage investment costs, then improves as portfolio companies mature and exit through initial public offerings or acquisitions.
The 2-and-20 fee structure converts gross returns into net returns. A fund producing 25% gross returns might deliver 18% to 20% net IRR to limited partners once the 2% annual management fee and 20% carried interest are taken out, and the gap between gross and net is what determines actual investor outcomes.
How Are Venture Capital Returns Measured?
Venture capital returns are measured through cash-multiple metrics and time-weighted metrics used together. The measures are listed below:
- Cash-multiple measures: MOIC, DPI, and TVPI. MOIC reflects the total return multiple across distributed cash and remaining portfolio value, DPI measures cash actually returned to investors, and TVPI combines realized distributions with unrealized portfolio value.
- Time-weighted measures: IRR expresses returns as an annualized percentage and accounts for the speed of capital deployment and return, though early returns can distort the figure.
- Combined analysis: pairing MOIC with IRR captures both the magnitude and the timing of returns, since MOIC shows the scale of gains while IRR adds the time dimension.
IRR as a Venture Capital Return Metric
IRR is the annualized time-weighted return that brings a fund’s inflows and outflows to a net present value of zero. Funds report it two ways: gross IRR excludes fees, and net IRR includes management fees and carried interest, which makes net IRR the figure that matters to investors.
IRR misleads when read alone because it is sensitive to timing, inflating early on quick exits or paper gains that later performance does not support.
Benchmark data places top-quartile venture funds above 20% net IRR, median funds between 10% and 15%, and bottom-quartile funds below 5%, according to “US PE/VC Benchmark Commentary: First Half 2025” by Cambridge Associates, January 2026. Because IRR carries the time dimension, investors read it alongside MOIC, which measures capital returned and ignores timing entirely.
MOIC as a Venture Capital Return Metric
MOIC measures total value returned to investors divided by capital contributed, expressed as a ratio such as 2.5x or 3.0x. Funds calculate MOIC gross, before fees and carried interest, or net, after both, and the difference between the two separates total fund performance from what limited partners actually receive.
MOIC sits inside a family of value-to-capital measures alongside DPI and TVPI. DPI captures only realized cash returned to investors, while TVPI adds the residual value of investments still held.
The limitation of MOIC is that it ignores time. A 3x return over three years and a 3x return over ten years look identical under MOIC, which is why funds pair it with IRR.
How Much Do Venture Capital Funds Typically Return?
Cambridge Associates benchmark data shows venture capital funds returning a wide range of outcomes, with top-quartile funds far ahead of median ones. Top-quartile funds reach net IRRs of 15% to 25% and TVPI multiples above 2.5x, while median funds deliver net IRRs around 10% to 12% and TVPI multiples between 1.5x and 2.0x.
Vintage year drives much of the variance, reflecting market conditions at the time of investment and exit. Mature vintages from 2016 to 2020 show top-quartile TVPI of roughly 2.6x to 3.6x against median TVPI near 1.5x to 2.0x.
Limited partners underwrite a strong venture fund at 2x to 3x over its life, and vintage selection moves that outcome materially. Bottom-quartile funds fall below 1.3x TVPI or fail to return capital at all, which concentrates results among managers who reach the outlier winners. Carta data covering US fund vintages from 2017 to 2021 shows the same spread widening at both the median and the top quartile.
How Many Venture-Backed Startups Fail to Return Capital?
Around three-quarters of venture-backed startups fail to return cash to investors. Research by Shikhar Ghosh of Harvard Business School, covering 2,000 venture-backed companies that raised at least $1 million between 2004 and 2010, found 75% never returned cash to investors, with 30% to 40% liquidating and losing the entire principal.
Deal-level data lands in the same range. A Correlation Ventures study of more than 27,000 investments between 2009 and 2018 found 64% of venture capital deals did not return the original principal, as reported in “Portfolios and Venture Capital” by Deutsche Bank Wealth Management, August 2021.
The failure rate is the mechanism behind the power law rather than a flaw in it. Most investments fail, and the few that succeed must generate enough to cover the losses and produce the fund’s return.
What Is Considered a Good IRR for a Venture Capital Fund?
A good net IRR for a venture capital fund runs from 15% to 25%. Top-quartile funds clear 20%, top-decile funds exceed 25% to 30%, and median funds land closer to 10% to 15%, which frequently fails to beat public market equivalents once the illiquidity premium is priced in.
A venture fund’s net IRR has to surpass the public market equivalent benchmark, usually measured against the S&P 500, to justify a capital lock-up of roughly ten years and the higher risk of private company investing.
Quartile spread sets the threshold. Top-quartile funds post net IRRs in the high teens to mid-twenties while bottom-quartile funds deliver single-digit or negative returns, a dispersion documented in “US PE/VC Benchmark Commentary: First Half 2025” by Cambridge Associates, January 2026, and a good IRR has to compensate limited partners for illiquidity, concentration risk, and a deal-level failure rate near 64%.
How Do Venture Capital Returns Vary by Fund Stage?
Venture capital returns vary by fund stage, with target multiples scaling inversely against the maturity of the companies backed. Seed funds chase the highest multiples at the highest risk, and late-stage funds accept the lowest multiples for the greatest predictability.
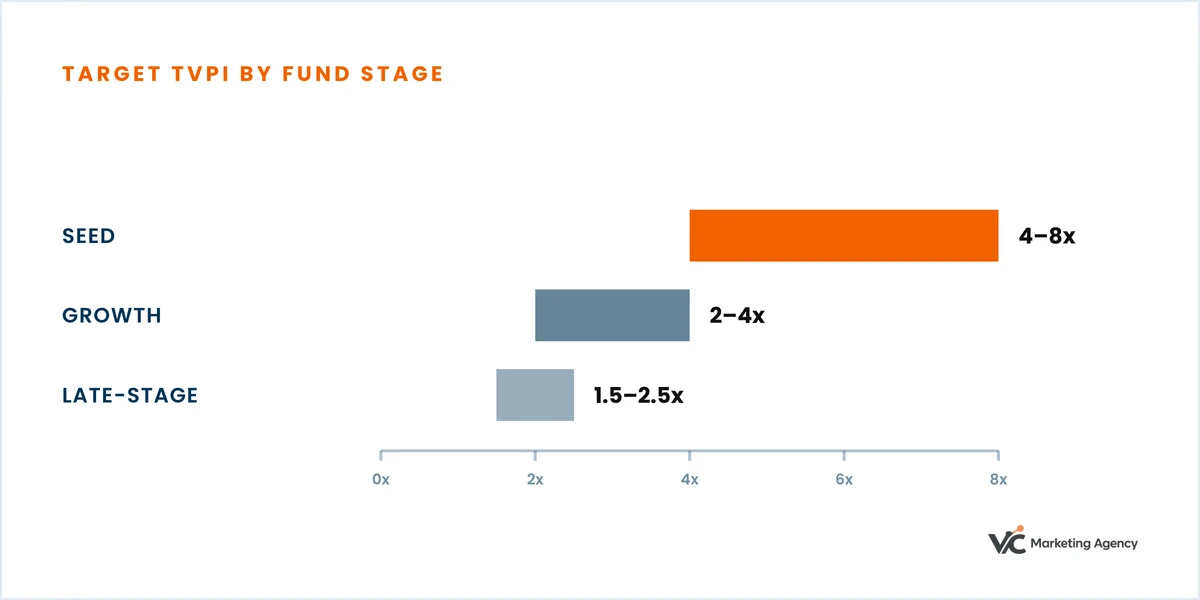
Seed-stage funds target 4x to 8x TVPI, with successful investments reaching 5x to 10x. Return variance is widest at seed, top-quartile net IRR clears 25% to 30%, and roughly 65% to 75% of seed deals return less than 1x.
Growth-stage funds target 2x to 4x TVPI with moderate dispersion and top-quartile net IRR between 15% and 25%, and roughly 20% to 35% of investments fail to return principal.
Late-stage funds target 1.5x to 2.5x TVPI, with individual winners reaching 3x to 5x. Dispersion is narrowest at that stage, net IRR runs 12% to 20%, and the loss rate falls to 10% to 20%.
Seed-Stage Venture Capital Returns
Seed-stage venture capital returns carry the highest target multiples and the highest risk in the asset class. Seed funds underwrite individual investments at 10x or greater to offset failure rates, more than half of seed investments return no capital, and only about 40% to 45% of companies advance to Series A.
Return dispersion is widest at seed because the companies are pre-revenue and pre-product-market fit. Top-quartile seed funds achieve net IRRs above 25% to 30%, while median seed funds struggle to beat public-market benchmarks after fees.
Illiquidity runs 8 to 12 years at seed, which makes IRR unusually sensitive to exit timing. Seed performance depends on reaching the rare breakout winners that scale into billion-dollar outcomes.
Growth-Stage Venture Capital Returns
Growth-stage venture capital returns carry mid-range target multiples and lower default rates than seed. Growth funds target net TVPI multiples of 1.9x to 2.3x with net IRRs in the low-to-mid teens through high teens, backing companies that have already shown product-market fit and revenue traction.
Default rates at growth stage sit near 20%, well under seed levels, because more mature business models and operating metrics produce clearer exit paths and faster DPI progress.
Return dispersion is tighter at growth stage, clustering nearer the median with fewer extreme outliers. Larger investments and higher entry valuations compress the upside while raising the odds of returning at least 1x on each position.
Late-Stage Venture Capital Returns
Late-stage venture capital returns are the most conservative profile in the asset class. Late-stage funds target 1.5x to 2.5x MOIC, backing mature, revenue-generating companies near a liquidity event, and loss rates fall below 30% with some recent cohorts nearer 15%.
Dispersion is narrowest at late stage, producing more predictable outcomes than seed or growth funds at a lower ceiling. Late-stage investors trade explosive multiples for capital preservation and shorter time to exit.
Entry valuations in the hundreds of millions or billions force larger cheque sizes to reach meaningful ownership, which in turn requires larger exits to produce attractive returns. The low default rate and tight performance band make late-stage venture closer to growth equity or pre-IPO investing.
Which Venture Capital Firms Have the Highest Returns?
A small group of venture capital firms captures outsized returns, led by Andreessen Horowitz (a16z), Sequoia Capital, and Alumni Ventures. Their results come from deal selection and access to the startups that produce power-law outcomes.
Fund-level returns for private venture firms are rarely disclosed, so published figures come from leaked fund documents, press reporting, or the firms’ own marketing rather than audited public filings. Top-quartile performance concentrates among a narrow group of managers who reliably win allocations in breakthrough companies.
a16z Returns
Andreessen Horowitz has returned at least $25 billion net to its investors since the firm was founded in 2009, including $11.2 billion in 2021. Fund documents place its first fund at 11.3x net TVPI after fees as of 30 September 2025, or 9.1x once parallel funds are included, and hold the $900 million 2012 Fund III at 9.4x net TVPI, according to “Andreessen Horowitz Has Returned at Least $25 Billion Net to Its Backers Since the Firm’s Founding in 2009” by Eric Newcomer, September 2025.
Those results trace to a small number of positions in companies such as Facebook, Airbnb, and Coinbase, which is the power law working as designed. a16z enters high-conviction sectors aggressively and holds ownership through follow-on rounds, which amplifies gains from breakout companies.
The firm’s larger, later funds carry fund-size drag and higher entry valuations that compress returns against the smaller, earlier vehicles. Its 2016 Fund V and Parallel Fund V have been reported in the fourth quartile of their vintage.
Sequoia Capital Returns
Sequoia Capital has produced some of the highest disclosed multiples in venture capital, built on landmark positions in LinkedIn, YouTube, Airbnb, Unity, Square, Stripe, and WhatsApp. Bloomberg reported in December 2020 that Sequoia Capital XI, the 2003 fund holding LinkedIn and YouTube, returned roughly 8x net of fees; the 2006 Fund XII, holding Airbnb and Unity, returned 10.9x; and Sequoia Capital 2010, holding Square, Stripe, and WhatsApp, returned 11.1x.
Concentration explains the pattern. Across the capital raised in 2003, 2007, and 2010, Sequoia made 155 US venture bets, of which 20 produced a net multiple above 10x and a profit of at least $100 million.
Sequoia identifies breakout companies early and holds them through successive rounds until a few exits carry the fund, which places its funds in the top quartile and frequently the top decile of venture returns.
Alumni Ventures Returns
Alumni Ventures runs a different model from traditional venture firms, operating affinity-based funds tied to university alumni networks. The firm invests smaller amounts across a broad portfolio, usually co-investing alongside established lead investors, which gives individual investors venture access at lower minimums than traditional funds require.
Alumni Ventures reports its funds as top quartile against Cambridge Associates venture benchmarks, though that claim comes from the firm’s own performance marketing rather than an independent disclosure.
The firm’s fee presentation has drawn regulatory attention. Alumni Ventures settled with the Securities and Exchange Commission in March 2022, repaying $4.7 million to affected funds and paying a $700,000 penalty, over marketing that described its fees as the industry-standard 2 and 20 while charging the full 20% management fee upfront rather than 2% annually across the fund’s ten-year term, according to the SEC’s announcement of the settlement, March 2022.
How Does Fund Size Affect Venture Capital Returns?
Fund size affects venture capital returns through ownership dilution and the size of exit required to move the fund. Larger funds deploy more capital per investment, writing bigger cheques at higher valuations, which erodes ownership percentages and shrinks the value captured from any given exit.
Research shows the gap directly: only 17% of funds above $750 million return more than 2.5x TVPI net of fees, against 25% of funds under $350 million. Average cumulative IRR runs near 9.7% for large venture funds and 17.4% for smaller ones, according to research by Sante Ventures on fund size and performance, and Carta data on 2017 to 2021 vintages shows micro-funds of $1 million to $10 million outperforming funds above $100 million at both median and top-quartile levels.
Mega-funds face a denominator problem, where the size of the pool forces participation in larger deals and pushes toward over-diversification and crowded rounds that raise entry valuations. Smaller funds concentrate on fewer high-conviction positions and hold meaningful ownership through follow-on rounds.
How to Increase Venture Capital Returns
Venture capital returns increase through three levers that act on entry price, loss rate, and outlier frequency. The levers are listed below:
- Entry-valuation discipline: buying into promising companies at lower valuations raises the multiple available at exit.
- Loss avoidance: rigorous diligence and risk assessment reduce the share of investments that fail to return capital, which preserves net fund performance.
- Right-tail frequency: systematically increasing exposure to potential breakout companies raises the odds of the outlier outcomes that carry a fund.
Those levers set the foundation, and marketing determines how much deal access and investor visibility a firm can bring to them.
How to Grow Venture Capital Firms with Marketing
Venture capital firms grow through marketing that improves deal flow, widens the limited partner pipeline, and builds brand authority. The levers are listed below:
- Deal flow: publishing thought leadership and market analysis positions the firm as an authority and attracts high-quality startups raising capital.
- LP pipeline: a strong digital presence across the firm’s website, LinkedIn, and X/Twitter raises visibility among institutional investors and builds the network a fundraise depends on.
- Brand authority: founder-focused events and workshops deliver value to entrepreneurs, strengthen relationships, and mark the firm as a value-add investor.
Each lever compounds the others, since visibility and credibility improve the quality of companies a firm sees and the terms it can win. Turning those levers into a working programme is what venture capital marketing covers in depth.
Why Choose Venture Capital Marketing Agency to Increase Venture Capital Returns?
Venture Capital Marketing Agency builds the marketing systems that feed the return levers directly. The reasons to choose the agency are listed below:
- Sector knowledge in venture capital: the agency works from a grasp of power-law dynamics and the role brand authority plays in reaching top-quartile deal flow.
- Dual-funnel optimization: the agency builds systems that strengthen deal flow and the LP pipeline at the same time, widening the field from which outlier returns emerge.
- Thought leadership and positioning: differentiated positioning brings better founders to a firm earlier, which improves entry valuations and ownership.
- Data-driven content strategy: educational content paired with sector command builds trust with entrepreneurs and institutional investors and shortens fundraising and deal cycles.
- Multi-channel execution: integrated campaigns across LinkedIn, email, content, PR, and events raise visibility among high-potential founders and qualified LPs.
- Performance accountability: every initiative ties to a measurable outcome, so spend maps to deal access, selection, and capital deployment.
Working with us, at Venture Capital Marketing Agency, gives a firm a team that treats marketing as a driver of deal quality and investor access rather than a support function.
What Types of Exits Generate Venture Capital Returns?
Venture capital returns are realized through three exit routes that convert equity stakes into cash. The exit types are listed below:
- Initial public offering (IPO): a portfolio company lists on a public exchange and the fund sells equity into the open market, which produces the highest returns where valuations expand sharply, as with Facebook and Google.
- Acquisition or merger: a larger company buys the startup and delivers immediate liquidity to the fund, the most common route, faster than an IPO though usually capping the ultimate multiple.
- Secondary sale: the fund sells its stake to another investor such as a late-stage fund or secondary buyer, providing early liquidity and portfolio de-risking at lower multiples, useful for managing fund duration and interim distributions.
Exit size and timing determine whether a portfolio company returns the whole fund or simply feeds the distribution waterfall. Top-performing funds draw most of their returns from a few exits above billion-dollar valuations.
How Do Venture Capital Returns Compare to Public Market Returns?
Venture capital returns beat the S&P 500 over long horizons and trail it over short and intermediate ones. Cambridge Associates data to 30 June 2025 puts the US Venture Capital Index at 12.3% over one year against the S&P 500’s 20.5%, 6.5% over five years against 14.9%, and 10.1% over ten years against 10.3%. The index moves ahead at 11.8% against 9.8% over fifteen years and 14.7% against 9.3% over twenty, according to “US PE/VC Benchmark Commentary: First Half 2025” by Cambridge Associates, January 2026.
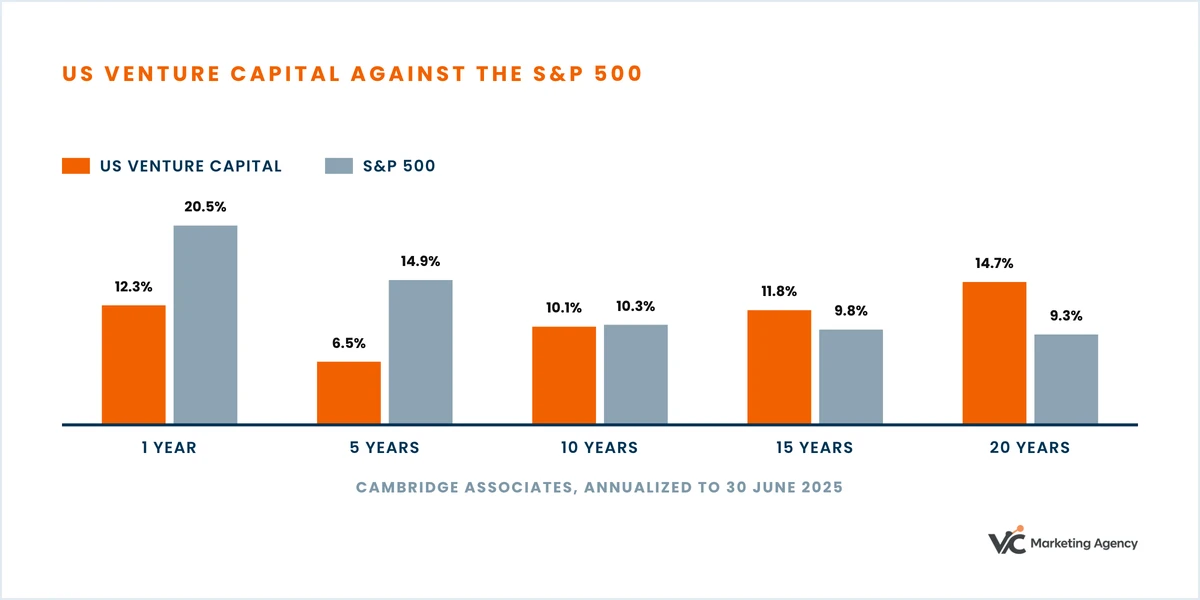
The illiquidity premium is what the long-horizon gap pays for, compensating investors for locking capital up for roughly a decade. Over intermediate periods the US venture benchmark has consistently beaten small-cap stocks while struggling to keep pace with the large-cap S&P 500 and the tech-heavy Nasdaq.
Manager selection matters more than asset-class exposure. “Portfolios and Venture Capital” by Deutsche Bank Wealth Management, August 2021, put the CA Global Venture Capital Index at 13.1% annualized over a twenty-year horizon against 5.9% for the S&P 500 and 7.8% for the Russell 2000, while co-investing alongside the top two quartiles of venture firms returned 76.1% over the same period, a figure that reflects selective co-investment rather than the return of a typical venture fund.
How Do Venture Capital Returns Ultimately Reward Investors in Startups?
Venture capital returns reward investors through the power law, where a small number of successful investments generate gains large enough to cover the many that fail. The top 5% to 10% of a portfolio reaches large exits through IPOs or major acquisitions and delivers the majority of the fund’s gains.
Those outliers have to offset a deal-level failure rate near 64%, which is why access to the right companies decides fund performance. A fund manager’s return depends on identifying and winning allocation in the potential outliers rather than on the average quality of the portfolio.
Successful venture funds reach a target multiple of 3x or higher in the top quartile despite those failure rates. The dependence on a few positions is what separates venture capital from private equity, where returns spread more evenly and rely less on individual winners.
How do venture capital returns compare to private equity returns?
Venture capital returns are more dispersed and more volatile than private equity returns. Venture capital follows a power law where a few investments produce outsized results, while private equity generates steadier outcomes from mature companies and operational improvement.
Cambridge Associates recorded the US Venture Capital Index at 6.4% for the first half of 2025 against 3.9% for the US Private Equity Index. Vintage-level results diverged across the same period, with private equity vintages from 2016 to 2023 returning between 0.6% and 6.9% and venture vintages from 2015 to 2022 ranging from -2.5% to 8.6%, according to “US PE/VC Benchmark Commentary: First Half 2025” by Cambridge Associates, January 2026.
Top-quartile venture funds outperform private equity while the median venture fund struggles to match public market equivalents. Venture capital offers the higher ceiling at the cost of greater volatility and a longer horizon, which puts the weight on selecting top-tier managers rather than on exposure to the asset class.