
Venture capital statistics are quantitative measures that track investment activity, deal flow, valuations, and returns across the global startup funding market. Global venture funding reached $425 billion across more than 24,000 companies in 2025, a 30% rise on the $328 billion recorded in 2024 and the third-largest annual total on record. Venture capital statistics measure capital deployed by institutional investors into high-growth startups, counting deal volume, round sizes, sector allocations, geographic distribution, exit outcomes, and fund performance.
Venture capital statistics matter because they signal market direction, reveal investor appetite, benchmark valuations, and indicate the health of innovation economies. The venture capital industry trends carried into 2026 follow the trajectory set in late 2025: artificial intelligence absorbing the majority of deal value, an IPO market reopening, mega-deal concentration in late-stage rounds, and rising startup failures as weaker companies fail to raise follow-on capital.
Tens of thousands of venture capital deals close globally each year, and funding splits unevenly across stages, with seed rounds taking the smallest share and late-stage growth rounds absorbing the majority of capital. Artificial intelligence now leads sector allocation, followed by fintech, healthtech and biotech, deep tech, blockchain, and gaming. Venture capital firms invest in marketing across content, thought leadership, branding, and founder communications, and the United States leads global investment ahead of China and Europe.
Fund performance statistics report investor returns through internal rate of return (IRR), total value to paid-in capital (TVPI), and distributions to paid-in capital (DPI). Venture capital sits within a wider private funding market alongside angel investment, private equity, and corporate venture arms, and angel investors differ from venture capital firms in check size, stage, and decision speed. Read together, those measures show the health of global startup funding.
What are Venture Capital Statistics?
Venture capital statistics are quantitative measures that capture the flow of institutional capital into high-growth startups and emerging companies. The measures cover total capital invested, deals closed, average deal sizes, valuation levels, fund performance returns, exit activity, and sector allocation patterns. Investors, entrepreneurs, policymakers, and analysts rely on that data infrastructure to read funding dynamics inside the innovation economy.
The scope of venture capital statistics runs across professional, institutional investments from seed through late-stage growth rounds. The data documents inputs such as capital deployed and outputs such as returns generated through exits. Aggregation happens at several levels, globally, regionally, by country, by sector, and by funding stage, which lets stakeholders compare benchmarks and detect emerging patterns in startup financing.
Venture capital statistics share three defining characteristics: a focus on professional investment, tracking across funding stages, and the capture of market signals. Those signals include mega-deal concentration, the health of the exit environment through IPO and acquisition activity, dry powder levels of committed but undeployed capital, and performance metrics that reveal actual returns to investors.
How are Venture Capital Statistics Measured?
Venture capital statistics are measured through systematic data collection from specialized deal databases. Those databases aggregate regulatory filings, press releases, and direct submissions from venture capital firms and startups, and providers such as PitchBook, Crunchbase, and CB Insights apply proprietary methodologies to verify and categorize each transaction.
Providers report different totals for the same market because their definitions differ. Divergence arises from how each classifies venture capital against other private investment types, which funding stages it includes, and how wide its geographic scope runs. Some providers count only disclosed amounts while others estimate undisclosed transactions.
The 2025 global figures show that spread directly: Crunchbase recorded $425 billion in global venture funding while PitchBook recorded $512 billion in global deal value for the same year. Comparing statistics from a single source is the only reliable way to track market change over time.
What Key Metrics Do Venture Capital Statistics Track?
The key metrics that venture capital statistics track are listed below:
- Capital raised and invested: the total dollar amount of venture capital deployed into startups and the capital raised by venture funds from limited partners, which indicates funding appetite and market liquidity.
- Deal count: the number of venture capital transactions completed in a period, which shows market activity levels and the breadth of capital deployment.
- Average and median deal size: the amount invested per transaction, where the average reflects the arithmetic mean and the median controls for outliers to show standard transaction values.
- Pre-money and post-money valuations: a company’s worth immediately before and after a funding round, where pre-money sets the negotiating base and post-money includes the new capital and determines dilution.
- Dry powder: committed capital that venture capital firms have raised but not yet invested, where high levels signal future investment capacity.
- Exits through IPO and acquisition: how venture-backed companies return capital to investors, which indicates the health of liquidity pathways.
- Fund returns (IRR, TVPI, DPI): investor performance, where IRR measures annualized percentage gains, TVPI shows total portfolio value against invested capital, and DPI tracks realized cash returned to investors.
- Unicorn count: the number of privately held venture-backed companies valued at $1 billion or more, which proxies startup success and value concentration.
Which Organizations Publish Venture Capital Statistics?
The organizations that publish venture capital statistics are PitchBook, Crunchbase, the National Venture Capital Association (NVCA), CB Insights, and KPMG Venture Pulse. Each covers the market from a different angle through regular reports and data analysis.
PitchBook
PitchBook covers private market data across venture capital, private equity, and mergers and acquisitions worldwide. The platform reports deal flow, valuations, fund performance, exit outcomes, and investor profiles from seed through late-stage across every major market. Institutional investors, corporations, and service providers use PitchBook for benchmarking, and its database ranks among the most detailed records of private market transactions.
Crunchbase
Crunchbase tracks startups, venture capital investments, and funding rounds globally, with emphasis on emerging companies and early-stage activity. The platform aggregates regulatory filings, news outlets, user submissions, and partnerships, combining self-reported data with verified transactions. Real-time updates on funding announcements, acquisitions, and company profiles make Crunchbase a working tool for investors, corporate development teams, and researchers.
National Venture Capital Association (NVCA)
The National Venture Capital Association is the trade association for the US venture capital industry and combines data with policy advocacy. In partnership with PitchBook, NVCA publishes the annual NVCA Yearbook and the quarterly Venture Monitor, which report American venture capital trends, policy developments, and industry benchmarks. Coverage centres on domestic deal activity, fund formation, exits, and investor composition.
CB Insights
CB Insights covers technology market intelligence and venture capital analytics, combining deal data with predictive signals and trend analysis. The platform concentrates on sectors such as artificial intelligence, fintech, and digital health, which makes it useful for reading how capital moves inside a startup category rather than across the aggregate market. Its quarterly State of Venture reports cover global venture activity, unicorn tracking, and patent analytics.
KPMG Venture Pulse
KPMG Venture Pulse is a quarterly global report that pairs deal data with macroeconomic analysis and regional breakdowns. The series tracks funding, deal activity, exits, and dominant sectors across the Americas, Europe, Asia, and emerging regions. Venture Pulse is built for reading shifts in funding concentration, late-stage against early-stage dynamics, and the role of large rounds in high-growth industries.
How Often Are Venture Capital Statistics Updated?
Venture capital statistics are updated on two cadences: quarterly monitors and annual yearbooks. PitchBook, Crunchbase, CB Insights, and KPMG Venture Pulse release quarterly reports within four to six weeks of a quarter’s close, giving near-real-time visibility into deal flow, funding volumes, and sector shifts as they develop.
Annual yearbooks arrive once a year, usually in the first quarter after the calendar year closes. The NVCA Yearbook reports finalized deal counts, funding totals, and performance benchmarks that incorporate late-reported transactions and corrected valuations, producing the most complete reconciled dataset for year-over-year comparison at the cost of timeliness.
Both cadences serve different decisions. Quarterly updates guide tactical moves and flag inflection points, while annual reports anchor strategic planning and long-run historical context.
Why are Venture Capital Statistics Important?
Venture capital statistics are important because they show market direction and guide investment decisions. The data reveals whether funding is expanding or contracting, which sectors are gaining momentum, and how investor confidence shifts across stages and geographies. Tracking deal counts, valuations, funding volumes, and exit activity lets stakeholders identify opportunities and anticipate corrections before they fully arrive.
Venture capital statistics double as benchmarks for performance evaluation. Limited partners use IRR, TVPI, and DPI to assess fund performance against industry standards. Venture capital firms use deal-size averages and valuation data to calibrate investment strategy and pricing discipline. Founders use the same figures to understand realistic valuation ranges for their stage and sector and to set fundraising expectations.
The data guides strategic allocation across the whole market. Institutional investors decide how much capital to commit to venture as an asset class, corporate venture arms identify sectors matching their priorities, and governments measure the effectiveness of innovation policy. In an industry where information asymmetry runs high and outcomes stay uncertain, reliable statistics reduce risk and improve decision quality.
What are venture capital industry trends?
Venture capital industry trends in 2026 centre on funding concentration and a market reshaped by artificial intelligence. AI now absorbs the majority of deal value rather than a slice of it, and that concentration marks the clearest break from the 2022 and 2023 correction. The IPO market has reopened, giving venture-backed companies exit routes that were closed for two years.
Mega-deals continue to concentrate capital into fewer, larger rounds. The pattern reflects a flight to quality, with investors committing heavily to a small number of late-stage AI infrastructure and enterprise companies.
Concentration at the top has raised failure rates below it, as companies funded during the COVID-era boom fail to secure follow-on rounds. Half of all 2025 US deal value went into just 0.05% of completed deals, according to the Q4 2025 PitchBook-NVCA Venture Monitor, published by PitchBook and the National Venture Capital Association in January 2026. Record venture-backed failures now sit alongside a reopening IPO market and high dry powder levels, which points to consolidation and pent-up capital at the same time.
How much venture capital was invested globally in the most recent year?
Crunchbase data shows global venture capital investment reached $425 billion across more than 24,000 companies in 2025, a 30% increase on the $328 billion recorded in 2024. The 2025 total ranks third-largest year on record, behind only 2021 and 2022.
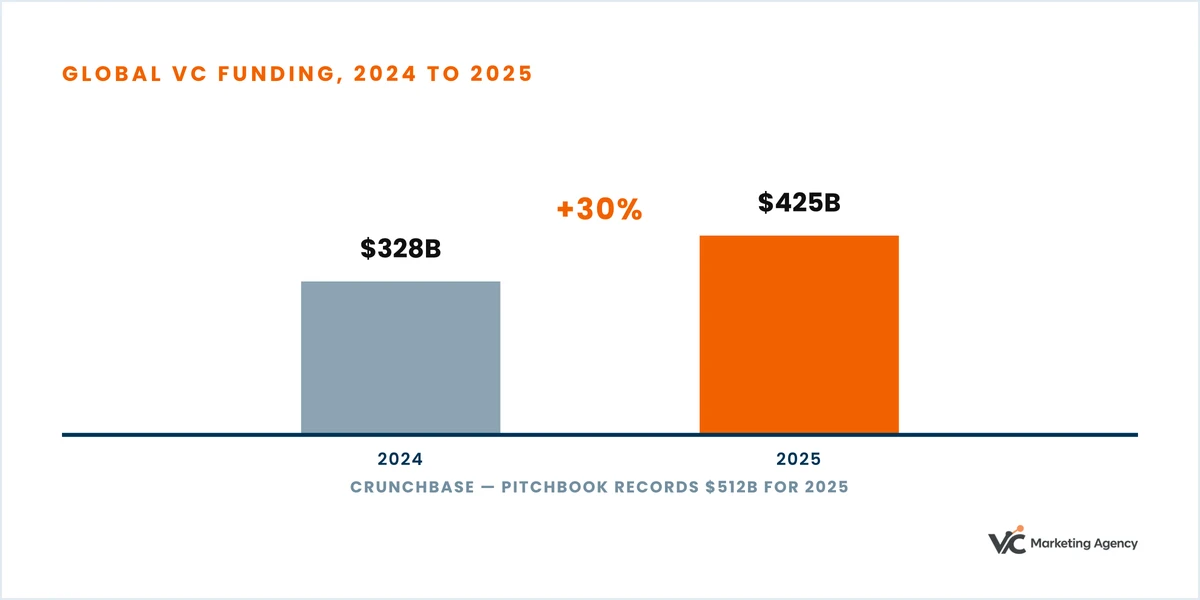
Provider methodology moves the headline number. PitchBook recorded $512 billion in global venture deal value for 2025, the second-highest annual total in its dataset, against Crunchbase’s $425 billion for the same period, a gap of $87 billion produced by definitional differences alone.
Artificial intelligence drove the recovery under either measure. Five AI companies, OpenAI, Scale AI, Anthropic, Project Prometheus, and xAI, each raised more than $5 billion in 2025, and together those five rounds accounted for $84 billion, or 20% of all venture capital funding for the year.
How has global venture capital funding trended since the 2021 peak?
Global venture capital funding has moved through a full cycle since the 2021 peak. Low interest rates and abundant liquidity produced record funding levels and inflated valuations across technology in 2021. Rising rates and economic uncertainty then triggered a sharp correction through 2022 and 2023, resetting valuations and cutting deal activity.
The market stabilized in 2024 at $328 billion globally, with investors weighting profitability over growth at any cost. Funding then rebounded 30% to $425 billion in 2025, which ranks the year third on record behind 2021 and 2022, according to Crunchbase funding data.
The rebound is narrow rather than broad. Capital concentrated in AI-native companies and large rounds instead of returning across the whole market, which distinguishes the 2025 recovery from the peak conditions of 2021.
How many venture capital deals close globally each year?
Crunchbase counted more than 24,000 companies raising venture capital globally in 2025. In the United States alone, 16,709 deals closed during the year, according to the Q4 2025 PitchBook-NVCA Venture Monitor, published by PitchBook and the National Venture Capital Association in January 2026.
Deal volume sits below the 2021 peak while average deal size has climbed, which concentrates capital into fewer, larger rounds. The concentration is extreme at the top of the US market, where 50% of 2025 deal value went into 0.05% of completed deals.
The pattern points to a selective market. Investors are committing to high-value transactions in artificial intelligence and technology infrastructure while the total count of venture rounds stays under peak-era levels.
How is venture capital funding distributed across funding stages?
Venture capital funding distributes unevenly across stages, with late-stage rounds absorbing the majority of capital and seed rounds taking the smallest share. The distribution across stages is listed below:
| Funding Stage | Share of Total Funding | Typical Round Size |
|---|---|---|
| Pre-seed/Seed | 10–15% | $500K – $3M |
| Early-stage (Series A/B) | 25–30% | $10M – $34M+ |
| Late-stage/Growth | 60–65% | $50M – $500M+ |
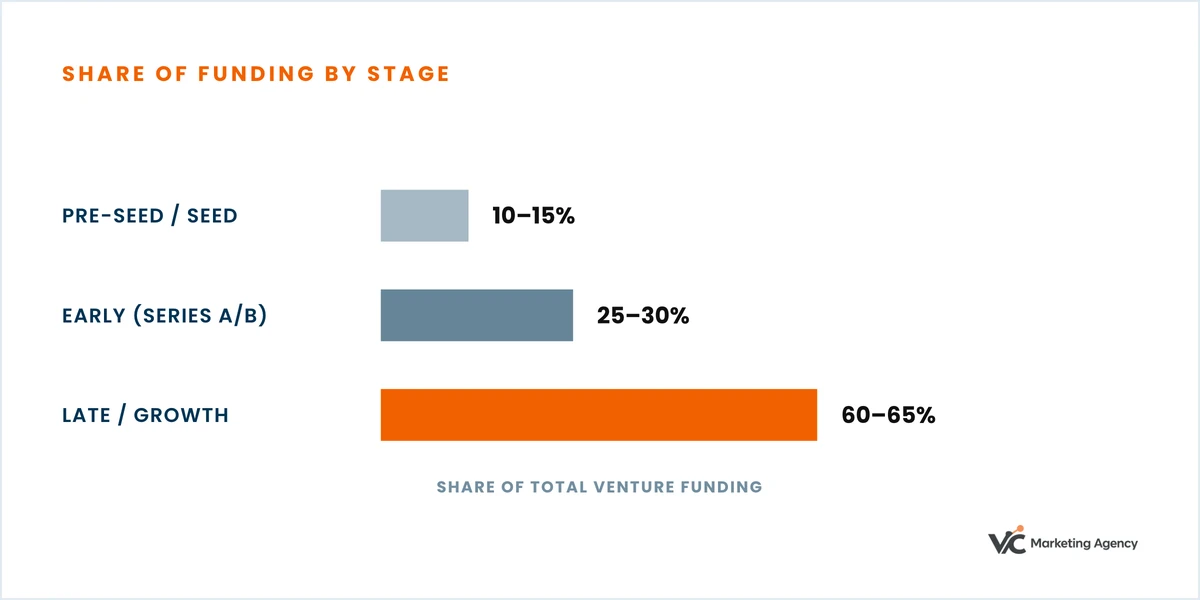
Late-stage and growth rounds absorb the majority of capital because their deal sizes run an order of magnitude above seed rounds. The stage split frames the role of seed funding as the entry point into the market, and the stages of venture capital funding set out what each round buys and what investors expect at it.
What share of venture capital goes to seed-stage startups?
Seed-stage startups capture 10% to 15% of total venture capital investment, the smallest share of any stage. Seed rounds remain the entry point for new companies and supply the earliest institutional capital.
Seed activity is growing despite its small share, supported by rising average deal sizes in artificial intelligence, robotics, and Web3. Investor appetite for emerging technologies has pushed early cheques higher, and seed funding continues to determine which companies reach the stages where the capital concentrates.
What share goes to early-stage Series A and B rounds?
Early-stage Series A and B rounds account for roughly 25% to 30% of total global venture capital investment. Companies raise at that stage as they move from proving a business model to scaling operations.
Series A funding scales a startup’s product and market reach, with average deal sizes running from $15 million to $25 million. Capital at that point expands the team, develops the product, and increases market penetration.
Series B rounds build on the Series A foundation, with typical investment from $25 million to $50 million or more depending on sector and geography. Those funds optimize operations, open new markets, and build business infrastructure.
What share goes to late-stage and growth-stage rounds?
Late-stage and growth-stage rounds command the largest share of venture capital, capturing 60% to 65% of total funding. The share reflects mega-round concentration, where established startups secure cheques above $100 million to drive scaling and international expansion.
Artificial intelligence infrastructure and autonomous vehicle platforms attracted billion-dollar growth rounds through 2025 and into 2026, deepening late-stage dominance. Late-stage rounds represent fewer deals than seed or early-stage rounds while average deal size stays high, producing a market of fewer deals and larger cheques aimed at companies with proven product-market fit.
Which industries attract the largest share of venture capital investment?
The industries that attract the largest share of venture capital investment are listed below in order of allocation:
- Artificial intelligence: AI leads venture capital funding by a wide margin, taking the majority of US deal value in 2025, driven by AI infrastructure, model training platforms, and AI-native developer tools.
- Fintech: fintech remains a major recipient while its growth rate has cooled against AI, with investment concentrated in payments, lending, and financial infrastructure.
- Healthtech and biotech: the sector holds a strong position in venture portfolios, with funding increasingly concentrated in AI-enabled healthcare and clinical software and weighted toward larger, late-stage rounds.
- Deep tech and robotics: deep tech is growing steadily, and investors favour companies with clear commercialization paths and technical differentiation.
- Blockchain and crypto: investment moves in waves, selective and cyclical rather than sustained.
- Gaming: gaming attracts the least venture capital of the major categories, reflecting a shift of investor focus toward enterprise and AI technologies.
AI and machine learning companies took 65.6% of all US venture capital deal value in 2025, up from 47.2% in 2024, according to the Q4 2025 PitchBook-NVCA Venture Monitor, published by PitchBook and the National Venture Capital Association in January 2026.
How much venture capital flows into artificial intelligence and software startups?
Artificial intelligence and software startups capture the majority of venture capital deal value. The Q4 2025 PitchBook-NVCA Venture Monitor found AI and machine learning companies took 65.6% of all US venture capital deal value in 2025, worth $222 billion of the $339.4 billion invested, up from 47.2% in 2024 and around 10% in 2015.
Globally the concentration is similar in direction and lower in degree. CB Insights put AI at about 48% of all global venture funding in 2025, roughly $226 billion and the largest share on record.
AI-washing complicates those figures, as companies present themselves as AI-driven without core AI capability, which inflates both valuations and apparent sector totals. Genuine AI companies continue to absorb the bulk of the capital.
How much venture capital flows into fintech and healthtech startups?
Fintech and healthtech both hold substantial venture capital allocation on distinct trajectories. Fintech retains its position among the top-funded sectors while cooling from pandemic-era peaks under interest rate pressure and regulatory constraint.
Healthtech is growing, driven by AI-enabled clinical tools and digital health platforms, with capital concentrating into larger rounds. US digital health companies raised $7.4 billion across 244 deals in the first half of 2026, ahead of the $6.4 billion raised across a similar number of rounds a year earlier, and median deal size rose to $14 million from $12 million in 2025, according to Rock Health’s “H1 2026 funding and market overview”, published July 2026.
How much capital are Venture capital firms investing in marketing?
Venture capital firms are increasing marketing investment, though firm-level spending figures stay largely undisclosed because the firms are private and face no standardized reporting requirement. Content creation and distribution take the largest share of that spend, building authority and visibility with founders and limited partners.
Thought leadership development follows, establishing partners as leading voices in their sectors. Branding and positioning separate firms in a competitive market by producing an identity that reaches both founders raising capital and limited partners assessing managers. Founder and portfolio company communications support keeps firm narratives aligned with strategy.
Performance measurement and analytics track how marketing affects deal flow and fundraising outcomes. Hard spending figures stay scarce because reporting is unstandardized and definitions of marketing against business development vary between firms, so budget allocation differs widely and firms split the work between internal teams and external agencies. Because each of those functions demands sector fluency and awareness of the rules governing securities marketing, much of the external share goes to a venture capital marketing agency rather than a generalist firm, which makes that choice a direct input into how well a marketing budget converts into deal flow and LP commitments.
What are latest Venture capital marketing trends?
The latest venture capital marketing trends are listed below:
- Content-led authority: firms build standing through high-quality content that demonstrates sector command and earns trust from founders and limited partners.
- Thought leadership: firms prioritize proprietary research and market commentary to position themselves as trusted voices in the market.
- Founder-led communications: firms extend the personal brands of founding and managing partners, using partner networks to build reputation and deal flow.
- Brand positioning: firms build differentiated identities that articulate investment theses, value propositions, and competitive advantage in a crowded market.
- Performance measurement: firms track marketing against deal flow quality, LP relationships, and portfolio support rather than vanity metrics.
Those five trends map to the disciplines set out in venture capital marketing, which covers the strategies, digital channels, and KPIs behind each one.
Which countries lead the world in venture capital investment?
The United States leads global venture capital investment, ahead of China and Europe. US dominance rests on technology hubs in the San Francisco Bay Area, New York, and Boston, which concentrate startup formation and financing.
China ranks second, with investment weighted toward artificial intelligence and autonomous vehicles and concentrated in Beijing, Shenzhen, and Shanghai. Europe ranks third as a regional bloc, centred on London, Berlin, and Paris.
Within Europe the United Kingdom holds the largest share, followed by Germany and France. Those rankings mark where the deepest pools of capital and the densest startup markets sit.
How does US venture capital investment compare with China and Europe?
US venture capital investment runs several times larger than Europe’s and China’s. US venture deal value reached $339.4 billion across 16,709 deals in 2025, the second-highest annual total on record behind the $358.2 billion peak of 2021.
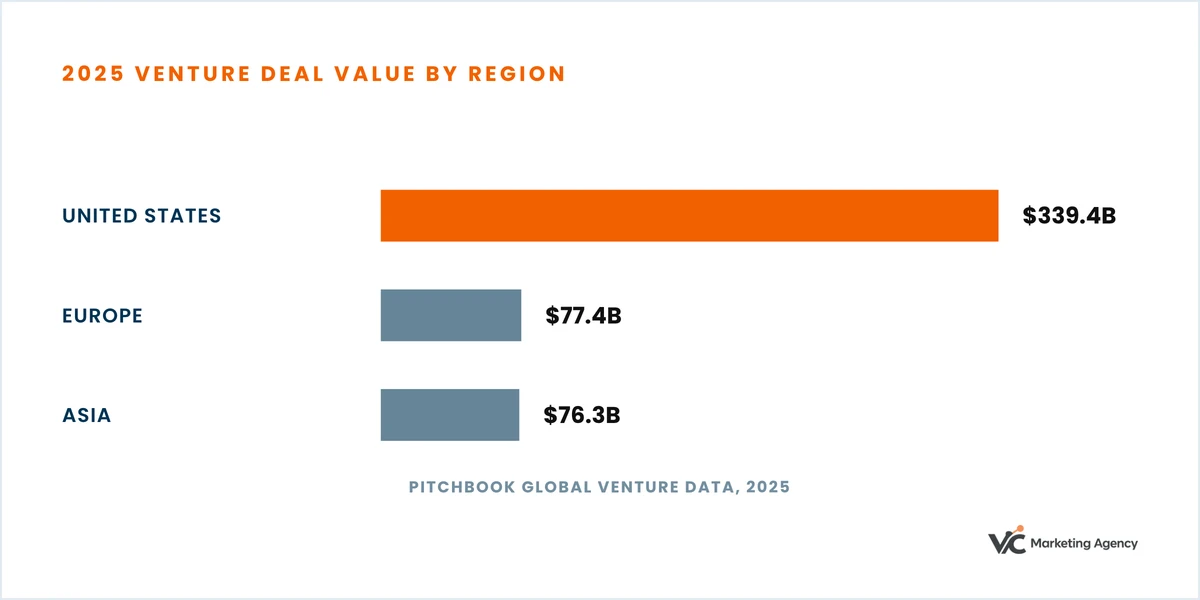
Europe recorded €66.2 billion, roughly $77.4 billion, in venture deal value for 2025, broadly flat year over year. Asia recorded $76.3 billion, with almost 40% of that annual total deployed in the fourth quarter alone, according to PitchBook global venture data.
Artificial intelligence explains most of the American lead, with AI and machine learning taking 65.6% of US deal value in 2025. The United Kingdom stands out within a broadly flat European market, while China’s recovery concentrates in AI and autonomous vehicles.
How much venture capital does the United States attract each year?
PitchBook and the National Venture Capital Association reported that the United States attracted $339.4 billion in venture capital across 16,709 deals in 2025. The figure is the second-highest on record, short of the $358.2 billion invested in 2021.
American fundraising moved in the opposite direction from deployment. US venture funds closed $66.1 billion in new commitments across 537 funds in 2025, the lowest fundraising total since 2018 and roughly 30% of the fund count recorded in 2021.
The gap between heavy deployment and weak fundraising defines the current US market: firms are investing at near-record levels out of capital raised in earlier vintages.
Which countries lead venture capital investment in Europe?
The United Kingdom leads venture capital investment in Europe, followed by Germany and France. The UK remains the largest and most active market, supported by a dense startup base and the deepest concentration of venture capital firms in the region, with London as the hub for technology and financial investment.
Germany holds second place with focus on sustainability and enterprise software, and France ranks third on the strength of its startup base. European venture activity stayed broadly flat in 2025 at €66.2 billion, and those three countries continue to account for most of the continent’s investment.
Which emerging markets are gaining venture capital investment?
The emerging markets gaining venture capital investment are India, the Middle East and North Africa, and Latin America. Each is drawing wider international attention as its startup base matures and regulatory conditions improve.
India leads among emerging markets, supported by a large domestic market and a wide engineering talent base. Growth concentrates in software, fintech, and AI-enabled healthcare, and the maturation of India’s technology sector has raised investor confidence.
The Middle East and North Africa show accelerating investment backed by government initiatives and sovereign wealth fund participation, with capital directed mainly at fintech and e-commerce. Latin America draws venture capital through expanding consumer markets and fintech innovation, and although it captures a smaller share than India or MENA, rising startup density and underpenetrated markets support continued growth.
What factors drive country-level venture capital investment rankings?
Country-level venture capital rankings are driven by the size and maturity of the startup base, the presence of large institutional investors, and the availability of exit routes. Mature markets attract more capital because they can support innovation at scale, institutional investors supply the money startups need to grow, and IPO and acquisition pathways let investors realize returns.
Economic stability and regulatory frameworks carry similar weight. Countries with steady growth and predictable regulation draw more venture capital than those without.
Talent concentration completes the picture. Density of STEM skills and the presence of innovation hubs pull investment toward a handful of cities, and cultural attitudes toward entrepreneurship and risk shape how much venture activity a country sustains.
How do venture capital statistics reveal fund performance and investor returns?
Venture capital statistics reveal fund performance through three metrics. Internal rate of return (IRR) measures the annualized time-weighted performance of a fund. Total value to paid-in capital (TVPI) shows total value created, combining realized proceeds and remaining portfolio value, as a multiple of invested capital. Distributions to paid-in capital (DPI) counts only cash returned to investors.
DPI has rebounded as exit windows reopened through 2024 and 2025, driven by renewed IPO activity and strategic acquisitions that let funds crystallize gains. Global venture exit value reached $549.2 billion in 2025, more than $200 billion above the 2024 figure.
Benchmarks put individual fund results in context. The median US venture fund returns roughly 1.5 to 1.8 times TVPI and 12% to 15% net IRR, while top-quartile funds return 20% to 30% or more in net IRR and bottom-quartile funds frequently lose capital, a dispersion exceeding 30 percentage points, according to Cambridge Associates US venture capital benchmark data.
Beyond returns, venture capital statistics show portfolio and sector performance. Unicorn count within a fund acts as a leading indicator of future distributions, and trends in fund size, deployment pace, and dry powder reveal whether managers are deploying capital or holding it back for want of quality deals.
How does venture capital fit within the broader private funding ecosystem?
Venture capital sits between angel investment and private equity in the private funding market. Angel investors supply the first capital that helps startups validate a concept and reach product-market fit. Venture capital firms then fund scaling and expansion, deploying institutional pools raised from limited partners. Private equity targets mature companies with established revenue, combining debt and equity to acquire controlling stakes and drive operational change.
The market further holds corporate venture capital arms, family offices, crowdfunding platforms, and government-backed innovation funds, each with a different risk appetite, cheque size, and strategic aim.
Knowing where venture capital sits on that spectrum helps founders match their growth stage to the right capital source, and it lets investors benchmark performance, allocate portfolios, and time entry across the funding lifecycle.
How does venture capital differ from private equity and angel investment?
Venture capital differs from private equity and angel investment in funding stage, ownership stake, and cheque size. Venture capital firms invest in early- to growth-stage companies, taking minority stakes between 10% and 30% with investments from $2 million to $50 million per round.
Private equity targets mature companies and acquires majority or full ownership, with transaction values running from hundreds of millions to billions of dollars. Angel investors work at the earliest stages, writing personal cheques between $25,000 and $250,000 for pre-seed and seed rounds in exchange for smaller equity positions.
How does angel investment compare to venture capital for early-stage startups?
Angel investment and venture capital both fund early-stage startups on different terms. The differences between angel investment and venture capital are listed below:
| Dimension | Angel Investment | Venture Capital |
|---|---|---|
| Typical Check Size | $25,000–$100,000 | $2 million–$15 million at seed and early stage |
| Funding Stage | Pre-seed and seed | Seed through late-stage and growth rounds |
| Ownership Stake | 5%–20% equity | 10%–30% equity, usually with board seats and protective provisions |
| Investor Involvement | Advisory role, hands-on mentorship, flexible terms | Active governance, board representation, structured milestone tracking |
| Decision Speed | Days to weeks, individual discretion | Weeks to months, committee approval and due diligence |
Angel investors write smaller cheques at pre-seed and seed, take minority positions, and offer relationship-driven terms centred on mentorship rather than board control. Venture capital firms commit larger sums from Series A onward, secure larger equity stakes with board seats and protective provisions, and run extended due diligence and committee approval that stretches decisions across weeks or months.
How do venture capital statistics reflect the overall health of global startup funding?
Venture capital statistics show a global startup funding market in recovery but not in balance. Global funding rose 30% to $425 billion in 2025, the third-largest annual total on record, which marks a clear rebound in investor confidence after the 2022 and 2023 correction.
Concentration qualifies that recovery. Artificial intelligence absorbed the majority of US deal value at 65.6%, five AI companies alone took 20% of global funding, and half of US deal value went into 0.05% of deals, so the aggregate rise conceals a narrow market beneath it.
The exit picture has improved materially, with global venture exit value reaching $549.2 billion in 2025, more than $200 billion above 2024. Against that, record venture-backed company failures and high dry powder levels show weaker companies exiting the market while committed capital waits to deploy.
Read together, the statistics describe a bifurcated market heading through 2026, where AI-led momentum runs alongside consolidation across the rest of the startup base.